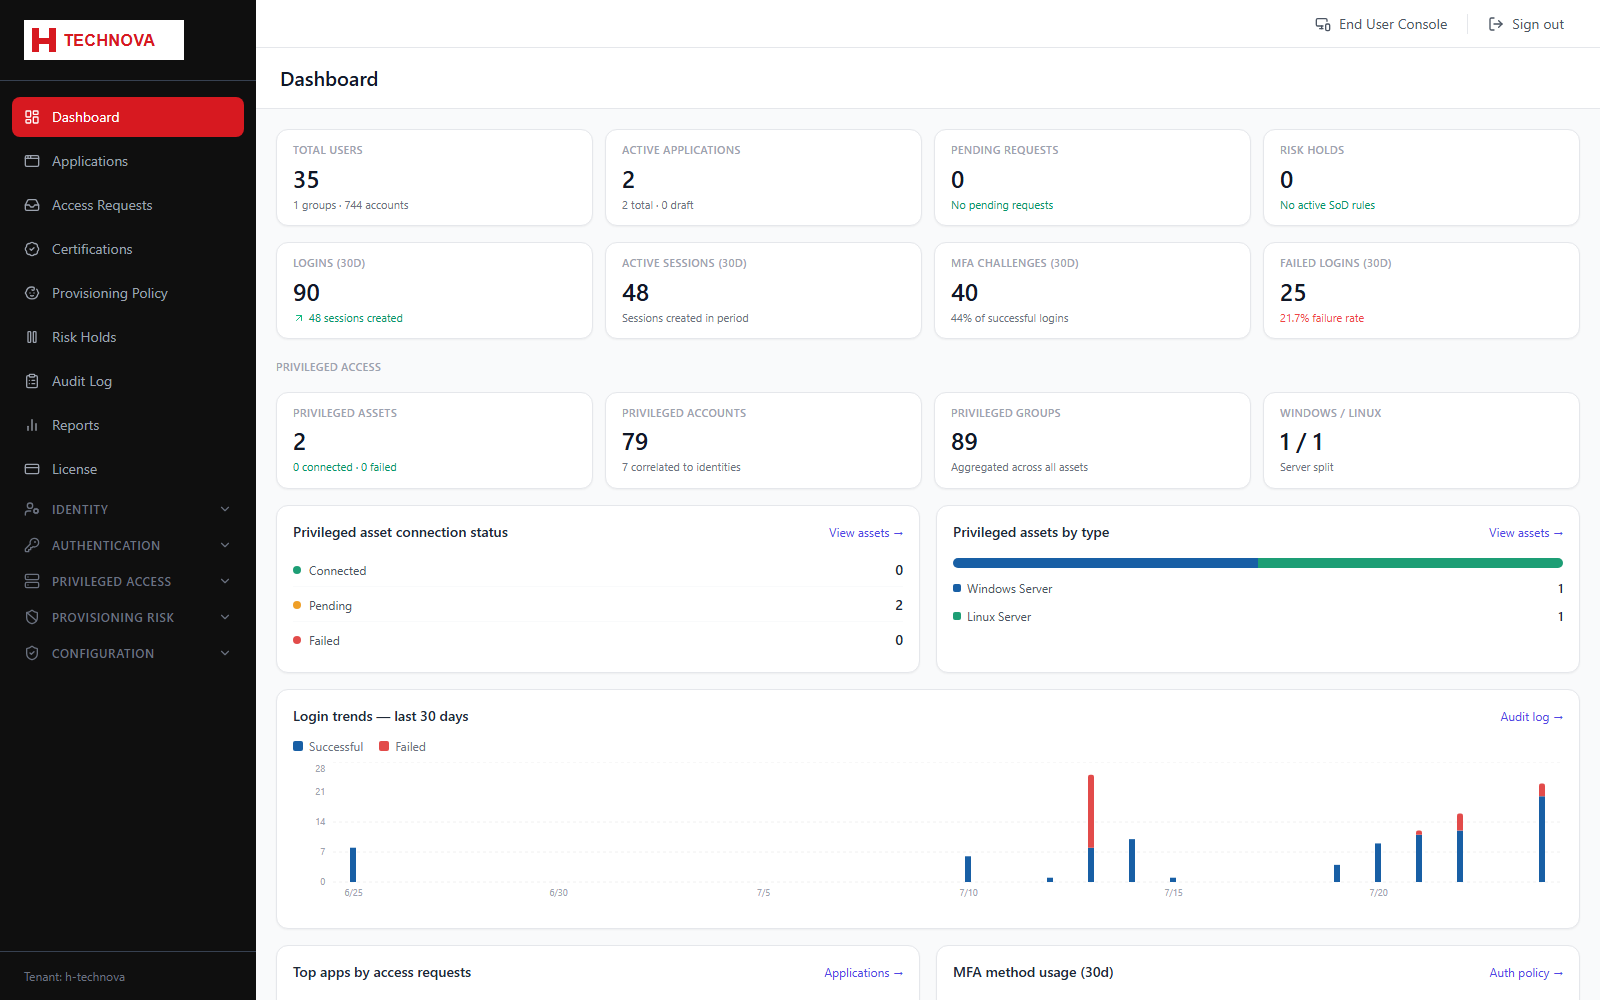
The Dashboard is the operational summary for the tenant: identity volume, application estate, outstanding work, authentication health and — when PAM is licensed — the privileged access estate. It is the fastest way to spot something that needs attention.
Dashboard — captured from the h-technova tenant.
How to use it
Read the top KPI row for scale: Total Users, Active Applications, Pending Requests and Risk Holds.
Read the second row for authentication health over the last 30 days: Logins, Active Sessions, MFA Challenges and Failed Logins with the failure rate.
Review the Privileged Access band for asset, account and group counts plus the Windows/Linux split.
Use Privileged asset connection status to find assets stuck in Pending or Failed — these will not aggregate or launch sessions.
Study Login trends for spikes in failed logins, which usually indicate credential stuffing or a broken integration.
Follow any "View assets →" or "Audit log →" link to jump straight to the underlying records.
Field reference
Field
Description
Total Users
All identities in the tenant, with group and account counts beneath.
Pending Requests
Access requests awaiting approval. A non-zero figure means somebody is waiting.
Risk Holds
Provisioning actions paused by a risk rule and awaiting review.
Failed Logins (30D)
Absolute count plus failure rate. A sustained rate above roughly 20% deserves investigation.
Privileged accounts
Aggregated privileged accounts, and how many are correlated to a Zetect identity.